OWL Watch
OWL Watch is an AI-powered log monitoring tool that automatically investigates errors in your application logs and suggests fixes by analyzing your source code.
What It Does
- Monitors log files - Watches your application logs in real-time (tail -f style)
- Detects errors - Identifies ERROR, WARN, FATAL messages and stack traces
- Investigates with AI - Uses a local LLM to analyze errors and read your source code
- Suggests fixes - Provides actionable code changes with explanations
Key Features
| Feature | Description |
|---|---|
| Real-time Detection | Monitors logs continuously, captures multi-line stack traces |
| AI Investigation | LLM reads your code, searches for related files, traces the error |
| Project Profiles | Understands your project structure, framework, and dependencies |
| Web Dashboard | Live error stream, searchable history, investigation interface |
| Feedback System | Track investigation accuracy with Accurate/Partial/Inaccurate ratings |
| Webhook Alerts | Send notifications to Slack, Discord, or custom endpoints |
How It Works
Log Error → Detect → Create Investigation → User clicks Investigate
         → LLM analyzes error + reads source code
         → Suggests fix with explanation
         → User applies fix and provides feedback
- OWL Watch detects an error in your logs
- Error appears in the dashboard with type and timestamp
- You click "Investigate" to start AI analysis
- The LLM examines the error and searches your codebase
- You receive a fix suggestion with the exact file and code to change
Supported Frameworks
OWL Watch has built-in error patterns for common frameworks:
- Java: Spring Boot, Spring
- Python: Django, Flask, FastAPI
- JavaScript: Express, React, Vue, Angular, Next.js
It works with any project - the LLM can read and understand any codebase.
Requirements
- Python 3.10+
- Ollama running locally
Quick Example
# Create a profile for your project
owl-watch study ./my-spring-app

# Start monitoring logs
owl-watch ./my-spring-app/logs/app.log --project my-spring-app
Open http://localhost:8080 to see the dashboard:
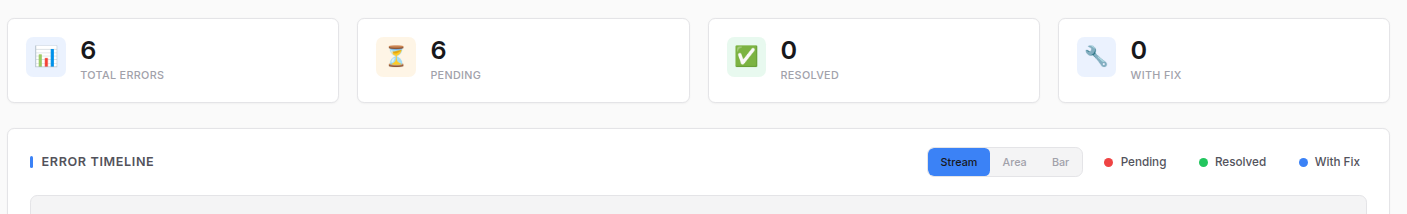
When an error occurs, click to investigate and get a fix:

Next Steps
- Installation - Set up OWL Watch and Ollama
- Quick Start - Monitor your first log file
- Features - Dashboard and investigation features